Pages

.

Showing posts with label Szybalski's rule. Show all posts

A Simple Method for Estimating the Rate of Transition vs. Transversion Mutations

Point mutations in DNA fall into two types: transition mutations, and transversion mutations. (See graphic below.)


In a transition mutation, a purine is swapped for a different purine (for example, adenine is swapped with guanine, or vice versa), or a pyrimidine is swapped with another pyrimidine (C for T or T for C); and usually, if a purine is swapped on one strand, the corresponding pyrimidine gets swapped on the other. Thus, a GC pair gets changed out for an AT pair, or vice versa.

A transversion, on the other hand, occurs when a purine is swapped for a pyrimidine. In a pairwise sense, this means a GC pair becomes a TA pair (for example) or an AT pair gets changed out for CG, or possibly AT for TA, or GC for CG.

Of the two types of mutation, transitions are more common. We also know that, in particular, GC-to-AT transitions are much more common than AT-to-GC transitions, for reasons that are well understood but that I won't discuss here. If you're curious to know what the experimental evidence is for the greater rate of GC-to-AT transitions, see Hall's 1991 Genetica paper (paywall protected, unfortunately) or the non-paywall-protected Y2K J. Bact. paper by Zhao. The latter paper is interesting because it shows that GC-to-AT transitions are more common in stationary-phase cells than exponentially-growing cells, and also, transitions in stationary E. coli are repaired by MutS and MutL gene products. (Overexpression of those two genes results in fewer transitions. Mutation of those two genes results in more transitions.)

An open question in molecular genetics is: What are the relative rates of transitions versus transversions, in natural populations? We know transitions are more common, but by what factor? Questions like this are tricky to answer, for a variety of reasons, and the answers obtained tend to vary quite a bit depending on the organism and methodology used. Van Bers et al. found a transition/transversion ratio (usually symbolized as κ) of 1.7 in Parus major (a bird species). Zhang and Gerstein looked at human DNA pseudogenes and found transitions outnumber transversions "by roughly a factor of two." Setti et al. looked at a variety of bacteria and found that the transition/transversion rate ratio for mutations affecting purines was 2.1 whereas the rate ratio for pyrimidines was 6.6. Tamura and Nei looked at nucleotide substitutions in the control region of mitochondrial DNA in chimps and humans (a region known to evolve rapidly) and found κ to be approximately 15. Yang and Yoder looked at mitochondrial cytochrome b in 28 primate species and found an average κ of 6.4. (In general, κ values tend to be considerably higher for mitochondrial DNA than other types of DNA.)

It's important to note that in all likelihood, no single value of κ will be universally applicable to all genes in all lineages, because evolutionary pressures vary from gene to gene and the rates of transition and transversion are different for different nucleotides (and so codon usage biases come into play). For an introduction to the various considerations involved in trying to estimate κ, I recommend Yang and Nielsen's 2000 paper as well as their 1998 and 1999 papers.

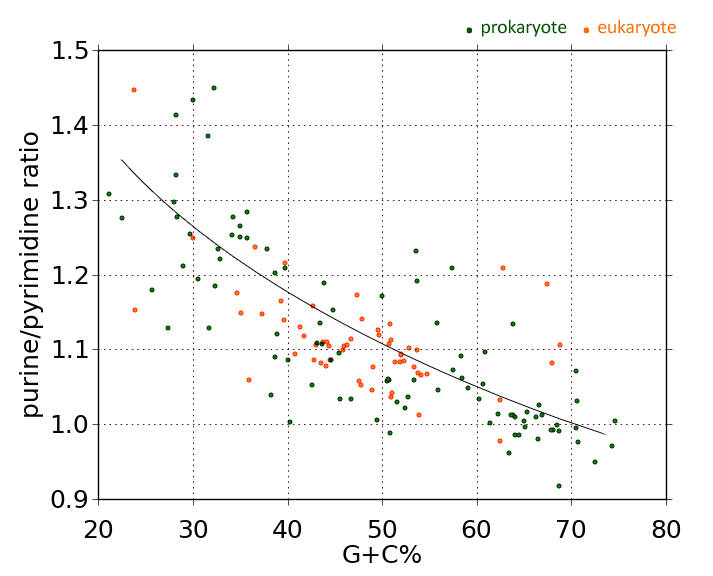
The reason I bring all this up is that I want to offer yet another possible way of estimating the transition/transversion rate ratio κ, using DNA composition statistics. Earlier, I presented data showing that the purine (A+G) content of coding regions of DNA correlates directly with genome A+T content. Analyzing the genomes of representatives of 260 bacterial genera, I came up with the following graph of purine mole-percent versus A+T mole-percent:


The correlation between genome A+T content and mRNA purine content is strong and positive (r=0.852) . Szybalski's Rule says that message regions tend to be purine-rich, but that's not exactly accurate. When genome A+T content is below approximately 35%, coding regions are richer in pyrimidines than purines. Above 35%, purines predominate. The concentration of purines in the mRNA-synonymous strand of DNA rises steadily with genome A+T content. It rises with a slope of 0.13013.

If you try to envision evolution taking an organism from one location on this graph to another, you can imagine that GC-to-AT transitions will move an organism to the right, whereas AT-to-GC transitions will move it to the left. To a first approximation (only!) we can say that horizontal movement on this graph essentially represents the net effect of transitions.

Vertical movement on this graph clearly involves transversions, because a net change in relative A+G content implies nothing less. To a very good first approximation, vertical movement in the graph corresponds to transversions.

Therefore, a good approximation of the relative rate of transitions versus transversions is given by the inverse of the slope. The value comes to 1.0/0.13013, or κ = 7.6846.

In an earlier post, I presented a graph like the one above applicable to mitochondrial DNA (N=203 mitochondrial genomes), which had a slope of 0.06702. Taking the inverse of that slope, we get a value of κ =14.92, which is in excellent agreement with Tamura and Nei's estimate of 15 for mitochondrial κ.

When I made a purine plot using plant and animal virus genomes (N=536), the rise rate (slope) was 0.23707, suggesting a κ value of 4.218. This agrees well with the transition/transversion rate for hepatitus C virus (as measured by Machida et al.) of 1.5 to 7.0 depending on the gene.

In short, we get very reasonable estimates of κ from calculations involving the slope of the A+G vs. A+T graph, across multiple domains.

The main methodological proviso that applies here has to do with the fact that technically, some horizontal movement on the graph can be accomplished with transversions (AT-to-CG, for example). We made a simplifying assumption that all horizontal movement was due to transitions. That assumption is not strictly true (although it is approximately true, since transitions do outnumber transversions; and some transversions, such as AT<-->TA and GC<-->CG, have no effect on genome A+T content). Bottom line, my method of estimating κ probably overestimates κ somewhat, by including a small proportion of AT<-->CG transversions in the numerator. Even so, the estimates agree well with other estimates, tending to validate the general approach.

I invite comments from knowledgeable specialists.

reade more... Résuméabuiyad

RNA Folding and Purine Loading

The other day I learned that an acquaintance of mine had done graduate work in a famous molecular genetics lab. We started "talking shop," and I happened to mention some of my recent bioinformatics forays, in particular my recent unexpected finding that the purine content of mRNA can be predicted from the G+C (guanine plus cytosine) content of the genome.

The purine (A+G) content of protein-coding regions of DNA correlates with the overall A+T content of the genome. The higher the A+T content of the double-stranded DNA, the higher the purine content of the single-stranded mRNA. A total of 260 bacterial genomes were analyzed for this graph. Organisms with very high A+T content tend to have relatively small genomes, which is one reason there is more scatter toward the right side of the graph. Correlation: r=0.852.

My friend asked what the implications of this might be. I offered a couple of thoughts. First, I said that just as differences in G+C content between genes in a given organism can sometimes be used to detect foreign genes (e.g., embedded phage/virus genes, horizontal gene transfers, etc.), variations in the purine to pyrimidine ratio of gene coding strands might also be a way to detect foreign genes. For example, in an organism like Clostridium botulinum, where the genome's coding regions have an average purine content of 58.5%, finding a gene with purine content below 46% (two standard deviations away from the mean) might be a tipoff that the gene came from a different organism. This is a useful new technique, because genes with high-purine-content coding regions don't always have high A+T content (thus, detection of horizontal gene transfers via purine loading will expose genes that would otherwise be missed on the basis of G+C  content). In other words, two genes might have exactly the same G+C (or A+T) characteristics but differ in purine content. The difference in purine content would be the tipoff to a possible horizontal-gene-transfer event.

Another implication of the A+G versus A+T relationship involves foreign RNA detection. Bacteria need to be able to detect self versus non-self nucleic acids. (Incoming phage nucleic acids need to be detected and destroyed; and in fact, they are. This is how restriction enzymes were discovered.) Messenger RNA has secondary structure: it undergoes folding, based on intrastrand regions of complementarity. The amount of complementarity depends on the relative abundances of purine and pyrimidines that can pair with one another. If a strand of RNA is mostly purines (or mostly pyrimidines, for that matter), there will be less opportunity to self-anneal than if purines and pyrimidines are equally abundant. Thus, the folding of RNA will be different in an organism with high genome A+T content (low G+C content) than in an organism with low A+T.

An example of how purine loading can affect folding is shown below. The graphic shows the minimum-free-energy folding of the mRNA for catalase in Staphylococcus epidermidis strain RP62A (left) and Pseudomonas putida strain GB-1 (on the right). The Staph version of this messenger RNA has a 1.28 ratio of purines to pyrimidines, whereas the Pseudomonas version has a 0.98 purine-pyrimidine ratio. As a result, the potential for purine-pyrimidine hydrogen bonding is considerably less in the Staph version of the mRNA than in the Pseudomonas version, and you can easily see this by comparing the two RNAs shown below. The one on the left has far more loops (areas where bases are not complementary) and complex branching structures. In the mRNA on the right, long sections of the molecule are able to line up to form double-stranded structures; loops are few in number, and small.

The minimum-free-energy folding for two catalase mRNAs, one with high purine content (Staphylococcus, left) and one with lower purine content (Pseudomonas, right). Foldings were generated by http://rna.tbi.univie.ac.at/cgi-bin/RNAfold.cgi. Click to enlarge image.

This kind of difference can explain the ability of various strains of bacteria to reject infectious RNA from another strain's viruses (phage). Foreign RNA entering a cell will "look" foreign to the cell's endogenous complement of RNA nucleases, and based on this, host nucleases will quickly destroy the intruder RNA. This mechanism provides a primitive kind of immune system for bacteria.

There is one other important implication of the purine-loading curve. The curve resolves one long-standing open question in molecular biology, having to do with mutation rates. I'll talk about it in tomorrow's post. Please join me then—and bring a biologist-friend!
reade more... Résuméabuiyad

A New Biological Constant?

Earlier, I gave evidence for a surprising relationship between the amount of G+C (guanine plus cytosine) in DNA and the amount of "purine loading" on the message strand in coding regions. The fact that message strands are often purine-rich is not new, of course; it's called Szybalski's Rule. What's new and unexpected is that the amount of G+C in the genome lets you predict the amount of purine loading. Also, Szybalski's rule is not always right.

Genome A+T content versus message-strand purine content (A+G) for 260 bacterial genera. Chargaff's second parity rule predicts a horizontal line at Y = 0.50. (Szybalski's rule says that all points should lie at or above 0.50.) Surprisingly, as A+T approaches 1.0, A/T approaches the Golden Ratio.
When you look at coding regions from many different bacterial species, you find that if a species has DNA with a G+C content below about 68%, it tends to have more purines than pyrimidines on the message strand (thus purine-rich mRNA). On the other hand, if an organism has extremely GC-rich DNA (G+C > 68%), a gene's message strand tends to have more pyrimidines than purines. What it means is that Szybalski's Rule is correct only for organisms with genome G+C content less than 68%. And Chargaff's second parity rule (which says that A=T an G=C even within a single strand of DNA) is flat-out wrong all the time, except at the 68% G+C point, where Chargaff is right now and then by chance.

Since the last time I wrote on this subject, I've had the chance to look at more than 1,000 additional genomes. What I've found is that the relationship between purine loading and G+C content applies not only to bacteria (and archaea) and eukaryotes, but to mitochondrial DNA, chloroplast DNA, and virus genomes (plant, animal, phage), as well.

The accompanying graphs tell the story, but I should explain a change in the way these graphs are prepared versus the graphs in my earlier posts. Earlier, I plotted G+C along the X-axis and purine/pyrmidine ratio on the Y-axis. I now plot A+T on the X-axis instead of G+C, in order to convert an inverse relationship to a direct relationship. Also, I now plot A+G (purines, as a mole fraction) on the Y-axis. Thus, X- and Y-axes are now both expressed in mole fractions, hence both are normalized to the unit interval (i.e., all values range from 0..1).

The graph above shows the relationship between genome A+T content and purine content of message strands in genomes for 260 bacterial genera. The straight line is regression-fitted to minimize the sum of squared absolute error. (Software by http://zunzun.com.) The line conforms to:

y = a + bx
 
where:
a =  0.45544384965539358
b = 0.14454244707261443


The line predicts that if a genome were to consist entirely of G+C (guanine and cytosine), it would be 45.54% guanine, whereas if (in some mythical creature) the genome were to consist entirely of A+T (adenine and thymine), adenine would comprise 59.99% of the DNA. Interestingly, the 95% confidence interval permits a value of 0.61803 at X = 1.0, which would mean that as guanine and cytosine diminish to zero, A/T approaches the Golden Ratio.

Do the most primitive bacteria (Archaea) also obey this relationship? Yes, they do. In preparing the graph below, I analyzed codon usage in 122 Archaeal genera to obtain A, G, T,  and C relative proportions in coding regions of genes. As you can see, the same basic relationship exists between purine content and A+T in Archaea as in Eubacteria. Regression analysis yielded a line with a slope of 0.16911 and a vertical offset 0.45865. So again, it's possible (or maybe it's just a very strange coincidence) that A/T approaches the Golden Ratio as A+T approaches unity.

Analysis of coding regions in 122 Archaea reveals that the same relationship exists between A+T content and purine mole-fraction (A+G) as exists in eubacteria.
For the graph below, I analyzed 114 eukaryotic genomes (everything from fungi and protists to insects, fish, worms, flowering and non-flowering plants, mosses, algae, and sundry warm- and cold-blooded animals). The slope of the generated regression line is 0.11567 and the vertical offset is 0.46116.

Eukaryotic organisms (N=114).

Mitochondria and chloroplasts (see the two graphs below) show a good bit more scatter in the data, but regression analysis still comes back with positive slopes (0.06702 and .13188, respectively) for the line of least squared absolute error.

Mitochondrial DNA (N=203).
Chloroplast DNA (N=227).
To see if this same fundamental relationship might hold even for viral genetic material, I looked at codon usage in 229 varieties of bacteriophage and 536 plant and animal viruses ranging in size from 3Kb to over 200 kilobases. Interestingly enough, the relationship between A+T and message-strand purine loading does indeed apply to viruses, despite the absence of dedicated protein-making machinery in a virion.

Plant and animal viruses (N=536).
Bacteriophage (N=229).
For the 536 plant and animal viruses (above left), the regression line has a slope of 0.23707 and meets the Y-axis at 0.62337 when X = 1.0. For bacteriophage (above right), the line's slope is 0.13733 and the vertical offset is 0.46395. (When inspecting the graphs, take note that the vertical-axis scaling is not the same for each graph. Hence the slopes are deceptive.) The Y-intercept at X = 1.0 is 0.60128. So again, it's possible A/T approaches the golden ratio as A+T approaches 100%.

The fact that viral nucleic acids follow the same purine trajectories as their hosts perhaps shouldn't come as a surprise, because viral genetic material is (in general) highly adapted to host machinery. Purine loading appropriate to the A+T milieu is just another adaptation.

It's striking that so many genomes, from so many diverse organisms (eubacteria, archaea, eukaryotes, viruses, bacteriophages, plus organelles), follow the same basic law of approximately

A+G = 0.46 + 0.14 * (A+T)

The above law is as universal a law of biology as I've ever seen. The only question is what to call the slope term. It's clearly a biological constant of considerable significance. Its physical interpretation is clear: It's the rate at which purines are accumulated in mRNA as genome A+T content increases. It says that a 1% increase in A+T content (or a 1% decrease in genome  G+C content) is worth a 0.14% increase in purine content in message strands. Maybe it should be called the purine rise rate? The purine amelioration rate?

Biologists, please feel free to get in touch to discuss. I'm interested in hearing your ideas. Reach out to me on LinkedIn, or simply leave a comment below.


reade more... Résuméabuiyad

Chargaff's Second Parity Rule is Broadly Violated

Erwin Chargaff, working with sea-urchin sperm in the 1950s, observed that within double-stranded DNA, the amount of adenine equals the amount of thymine (A = T) and guanine equals cytosine (G = C), which we now know is the basis of "complementarity" in DNA. But Chargaff later went on to observe the same thing in studies of single-stranded DNA, causing him to postulate that A = T and G = C more generally (within as well as across strands of DNA). The more general postulation is known as Chargaff's second parity rule. It says that A = T and G = C within a single strand of DNA.

The second parity rule seemed to make sense, because there was and is no a priori reason to think that DNA or RNA, whether single-stranded or double-stranded, should contain more purines than pyrimidines (nor vice versa). All other factors being equal, nature should not "favor" one class of nucleotide over another. Therefore, across evolutionary times frames, one would expect purine and pyrimidine prevalences in nucleic acids to equalize.

What we instead find, if we look at real-world DNA and RNA, is that individual strands seldom contain equal amounts of purines and pyrimidines. Szybalski was the first to note that viruses (which usually contain single-stranded nucleic acids) often contain more purines than pyrimidines. Others have since verified what Szybalski found, namely that in many organisms, DNA is purine-heavy on the "sense" strand of coding regions, such that messenger RNA ends up richer in purines than pyrimidines. This is called Szybalski's rule.

In a previous post, I presented evidence (from analysis of the sequenced genomes of 93 bacterial genera) that Szybalski's rule not only is more often true than Chargaff's second parity rule, but in fact purine-loading of coding region "message" strands occurs in direct proportion to the amount of A+T (or in inverse propoertion to the amount of G+C) in the genome. At G+C contents below about 68%, DNA becomes heavier and heavier with purines on the message strand. At G+C contents above 68%, we find organisms in which the message strand is actually pyrimidine-heavy instead of purine-heavy.

I now present evidence that purine loading of message strands in proportion to A+T content is a universal phenomenon, applying to a wide variety of eukaryotic ("higher") life forms as well as bacteria.

According to Chargaff's second parity rule, all points on this graph should fall on a horizontal line at y = 1. Instead, we see that Chargaff's rule is violated for all but a statistically insignificant subset of organisms. Pink/orange points represent eukaryotic species. Dark green data points represent bacterial genera. See text for discussion. Permission to reproduce this graph (with attribution) is granted.

To create the accompanying graph, I did frequency analysis of codons for 58 eukaryotic life forms (pink data points) and 93 prokaryotes (dark green data points) in order to derive prevalences of the four bases (A, G, C, T) in coding regions of DNA. Eukaryotes that were studied included yeast, molds, protists, warm and cold-blooded animals, flowering and non-flowering plants, alga, and insects and crustaceans. The complete list of organisms is shown in a table further below.

It can now be stated definitively that Chargaff's second parity rule is, in general, violated across all major forms of life. Not only that, it is violated in a regular fashion, such that purine loading of mRNA increases with genome A+T content. Significantly, some organisms with very low A+T content (high G+C content) actually have pyrimidine-loaded mRNA, but they are in a small minority.

Purine loading is both common and extreme. For about 20% of organisms, the purine-pyrimidine ratio is above 1.2. For some organisms, the purine excess is more than 40%, which is striking indeed.

Why should purines migrate to one strand of DNA while pyrimidines line up on the other strand? One possibility is that it minimizes spontaneous self-annealing of separated strands into secondary structures. Unrestrained "kissing" of intrastrand regions during transcription might lead to deleterious excisions, inversions, or other events. Poly-purine runs would allow the formation of many loops but few stems; in general, secondary structures would be rare.

The significance of purine loading remains to be elucidated. But in the meantime, there can be no doubt that purine enrichment of message strands is indeed widespread and strongly correlates to genome A+T content. Chargaff's second parity rule is invalid, except in a trivial minority of cases.

The prokaryotic organisms used in this study were presented in a table previously. The eukaryotic organisms are shown in the following table:

Organism Comment G+C% Purine ratio
Chlorella variabilis strain NC64A endosymbiont of Paramecium 68.76 1.1055181128896376
Chlamydomonas reinhardtii strain CC-503 cw92 mt+ unicellular alga 67.96 1.0818749999999997
Micromonas pusilla strain CCMP1545 unicellular alga 67.41 1.1873268193087356
Ectocarpus siliculosus strain Ec 32 alga 62.74 1.2090728330510347
Sporisorium reilianum SRZ2 smut fungus 62.5 0.9776547360094916
Leishmania major strain Friedlin protozoan 62.47 1.0325
Oryza sativa Japonica Group rice 54.77 1.0668412348401317
Takifugu rubripes (torafugu) fish 54.08 1.0655094027691674
Aspergillus fumigatus strain A1163 fungus 53.89 1.013091641490433
Sus scrofa (pig) pig 53.77 1.0680595779892428
Drosophila melanogaster (fruit fly)
53.69 1.0986989367655287
Brachypodium distachyon line Bd21 grass 53.32 1.0764746703677999
Selaginella moellendorffii (Spikemoss) moss 52.83 1.1014492753623195
Equus caballus (horse) horse 52.29 1.0844453711426192
Pongo abelii (Sumatran orangutan) orangutan 52 1.0929015146227405
Homo sapiens human 51.97 1.0939049081896255
Mus musculus (house mouse) strain mixed mouse 51.91 1.0827720297201582
Tuber melanosporum (Perigord truffle) strain Mel28 truffle 51.4 1.0836820083682006
Phaeodactylum tricornutum strain CCAP 1055/1 diatom 51.06 1.0418452745458253
Arthroderma benhamiae strain CBS 112371 fungus 50.99 1.0360268674944024
Ornithorhynchus anatinus (platypus) platypus 50.97 1.1121909993661525
Taeniopygia guttata (Zebra finch) bird 50.81 1.1344717182497328
Trypanosoma brucei TREU927 sleeping sickness protozoan 50.78 1.106974784013486
Danio rerio (zebrafish) strain Tuebingen fish 49.68 1.1195053003533566
Gallus gallus chicken 49.54 1.1265418970650787
Monodelphis domestica (gray short-tailed opossum) opossum 49.07 1.0768110918544194
Sorghum bicolor (sorghum) sorghum 48.93 1.046422719825232
Thalassiosira pseudonana strain CCMP1335 diatom 47.91 1.1403183213189638
Hyaloperonospora arabidopsis mildew 47.75 1.053039546400631
Daphnia pulex (common water flea) water flea 47.57 1.058036633052068
Physcomitrella patens subsp. patens moss 47.33 1.1727134477514667
Anolis carolinensis (green anole) lizard 46.72 1.113765477057538
Brassica rapa flowering plant 46.29 1.1056659411640803
Fragaria vesca (woodland strawberry) strawberry 46.02 1.1052853232259425
Amborella trichopoda flowering shrub 45.88 1.0992441209406494
Citrullus lanatus var. lanatus (watermelon) watermelon 44.5 1.0855134984692458
Capsella rubella mustard-family plant 44.37 1.1041257367387034
Arabidopsis thaliana (thale cress) cress 44.15 1.109853013573388
Lotus Japonicus lotus 44.11 1.0773228019122847
Populus trichocarpa (Populus balsamifera subsp. trichocarpa) tree 43.7 1.1097672456226706
Cucumis sativus (cucumber) cucumber 43.56 1.0823847862298719
Caenorhabditis elegans strain Bristol N2 worm 42.96 1.106320224719101
Vitis vinifera (grape) grape 42.75 1.0859833393697935
Ciona intestinalis tunicate 42.68 1.158652461848546
Solanum lycopersicum (tomato) tomato 41.7 1.1177
Theobroma cacao (chocolate) chocolate 41.31 1.1297481860862142
Medicago truncatula (barrel medic) strain A17 flowering plant 40.78 1.093754366354618
Apis mellifera (honey bee) strain DH4 honey bee 39.76 1.216042543762464
Saccharomyces cerevisiae (bakers yeast) strain S288C yeast 39.63 1.1387641650630744
Acyrthosiphon pisum (pea aphid) strain LSR1 aphid 39.35 1.1651853457619772
Debaryomyces hansenii strain CBS767 yeast 37.32  1.1477345930856775
Pediculus humanus corporis (human body louse) strain USDA louse 36.57 1.2365791828213537
Schistosoma mansoni strain Puerto Rico trematode 35.94 1.0586902800658977
Candida albicans strain WO-1 yeast 35.03 1.1490291609944834
Tetrapisispora phaffii CBS 4417 strain type CBS 4417 yeast 34.69 1.17503805175038
Paramecium tetraurelia strain d4-2 protist 30.03 1.2494922903347117
nucleomorph Guillardia theta endosymbiont 23.87 1.1529462427330803
Plasmodium falciparum 3D7 malaria parasite 23.76 1.4471365638766511
reade more... Résuméabuiyad

Chargaff's Second Parity Rule is Violated in Proportion to Genome A+T Content

Erwin Chargaff was the first to notice, in the early 1950s, before Watson and Crick deduced the structure of DNA, that the quantity of purines in DNA equals the quantity of pyrimidines (specifically, the amount of adenine equals the amount of thymine; and the amount of guanine equals the amount of cytosine). This observation was key to establishing the structure of DNA, and it is often cited as Chargaff's first parity rule. But Chargaff also made another observation (the second parity rule), namely that even within a single strand of DNA, the amount of adenine tends to equal the amount of thymine and the amount of guanine tends to equal the amount of cytosine.

It's easy to understand why the first parity rule holds true, because complementarity of DNA strands depends on A pairing with T and G pairing with C; these pairings give rise to the "rungs" of the DNA ladder and ensure that copying of strands occurs with total fidelity during cell division. But there doesn't seem to be any a priori reason why the second parity rule should hold true. And in fact, it often doesn't hold true, as Wacław Szybalski noted in 1966 when he reported finding imbalances of purines and pyrimidines in bacteriophage and other DNA samples. Szybalski observed that in most cases, protein-coding regions of DNA tend to have slightly more purines than pyrimidines on one strand and slightly more pyrimidines than purines on the other strand, such that messenger RNA ends up purine-heavy.

If you're having trouble visualizing the situation, imagine a very short (12-base) "chromosome" containing 50% G+C content. One possibility is that one strand looks like GGGGGGTTTTTT and the other strand is CCCCCCAAAAAA. In this case half the purines (all the G's) are on one strand and half (A's) are on the other. But you could just as easily have strands be GGGGGGAAAAAA and CCCCCCTTTTTT. In this case, one strand is all-purines, the other all-pyrimidines. Both examples violate Chargaff's second rule, which requires that G = C and A = T within each strand (e.g., GGGCCCTTTAAA + CCCGGGAAATTT would obey the rule).

To my knowledge, no one has yet reported the fact (which I'll now report) that the degree to which Chargaff's second parity rule is violated depends on the G+C content of the source genome (at least for bacteria). Simply put, organisms with a G+C content of around 68% obey Chargaff's rules. Organisms with more than 68% G+C content violate Chargaff's second rule in the direction of pyrimidine loading of mRNA. Organisms with less than 68% G+C content (which of course includes the overwhelming majority of organisms) have purine-heavy DNA, to a degree that depends on the amount of A+T in the DNA.

Purine/pyrimidine ratio (in coding regions) as a function of genome G+C content based on codon analysis of 93 organisms. As genomes become more A+T rich, mRNA becomes more heavily purine-loaded.

The above graph shows how this relationship works. To create the graph, I did a statistical analysis of codon usage in 93 bacterial species. Organisms were chosen so as to obtain representatives across the AT/GC spectrum. No genus is represented more than once. In order to get as broad a sampling as possible, I included 14 intracellular symbionts with ultra-low G+C content (plus one such creature—Candidatus Hodgkinia cicadicola—with a 58% G+C content); many extremophiles; heterotrophs and autotrophs; pathogens and non-pathogens; and organisms with large and small genomes. The complete organism list is presented in a table further below.

Codon usage statistics for each organism were obtained using tools at http://genomevolution.org. Relative prevalences of A, T, G, and C in the genomes' coding regions were determined by codon frequency analysis. The purine:pyrimidine ratio was simply calculated as (A+G)/(C+T) based on the codon-wise frequency of usage of each base.

What we see is that while there is a good deal of noise in the data, nevertheless it's quite clear that purine/pyrimidine ratios increase sharply as genome G+C decreases.Organisms for which Chargaff's second rule holds true (points falling at y = 1.0) are in a small minority. Most organisms have purine-rich coding regions, resulting in purine-rich mRNA.

Purine enrichment occurs for both adenine and guanine. For example, in Clostridium botulinum (genome G+C = 28.21%), codon analysis reveals G/C/A/T relative abundances (on the coding strand) of 18.3/10.8/40.3/30.6.

Intra-codon base position analysis reveals that purine enrichment is far more concentrated in position one of the codon than other positions. The graphs below show the purine balance on a position-by-position basis, for each base in a codon.

Most of the variation in purine/pyrimidine ratio happens in position 1 of the codon (the 'A' in ATG, for example). Notice that the purine/pyrimidine ratio in this position is well above 1.0 for all organisms.

Variation in purine loading at the second position of the codon is more carefully controlled (notice that there is less "scatter" in this graph). The y-axis scale is different here than in the previous graph, hence the slope is quite a bit less pronounced than it looks. Also, notice that most of the points in this plot are below parity (i.e., below 1.0 on the y-axis), indicating that this codon position is relatively pyrimidine-rich.

The third (so-called "wobble") position of the codon shows considerable variation in values, but the slope of the curve is less than in the previous two graphs, and this position is pyrimidine-rich for about two-thirds of the organisms.

It's well known that GC-skew tends to be exaggerated in position 3 of the codon. For example, if the overall genome G+C is 70%, the position-wise G+C for the wobble base may be 90%. Surprisingly, we find that purine loading is most exaggerated in position 1 of the codon, not position 3. Not only is the slope of the purine-ratio curve shallower in position 3 than for the other two base positions, only position 1 is actually purine-heavy: positions 2 and 3 tend to be net pyrimidine-rich. This fact (that purine loading is primarily localized to codon position 1, whereas GC-skew is exaggerated in position 3) might indicate that the forces responsible for purine loading are entirely different from the forces responsible for GC skew.

What might those forces be? What kinds of selection pressure might cause organisms to purine-load one strand of their DNA? One possibility is that purine loading of the coding strand is a strategy for protecting the "weaker" or more vulnerable strand from damage or mutations. Cytosine is thought to be particularly vulnerable to deamination (and later substitution with thymine, during repair). It's possible that the transcription process (which is asymmetric, in that RNA polymerase operates against just one strand of DNA, leaving the other strand free) is protective of the antisense strand of DNA. That is, in transcription, RNA polymerase cloaks the antisense strand and in so doing renders that strand less vulnerable to deamination events, rogue methylations, etc., while transcription is taking place.

An entirely different possibility is envisioned by an RNA World hypothesis. In this hypothesis, the genetic material of early ancestor organisms was single-stranded RNA. Since single-stranded RNA is not "complementary" to anything, there is no need for it to obey Chargaff symmetries. Thus, purine loading could have occurred prior to the advent of double-stranded DNA, and early organisms could have been uniformly AT-rich. In this model of the world, GC-rich genomes are a late development, and the processes responsible for creating GC-rich DNA led to genetic material with full Chargaff base parity.

We may not know for a long time (if ever) what the mechanisms of purine enrichment are. But we know for sure that purine accumulation is a widespread phenomenon in the bacterial world (operating across diverse clades) and happens in a way that encourages purine-rich mRNA in organisms with low G+C content in their genomes.


Organisms used in this study:

Organism GC% genome size
Anaeromyxobacter dehalogenans 2CP-1 74.67 5009007
Cellulomonas flavigena strain DSM 20109 74.29 4123179
Xylanimonas cellulosilytica strain DSM 15894 72.47 3831380
Streptomyces bingchenggensis strain BCW-1 70.75 11936683
Myxococcus fulvus strain HW-1 70.63 9003593
Rubrobacter xylanophilus strain DSM 9941 70.48 3225748
Rhodospirillum centenum ATCC 51521 70.46 4355543
Actinomyces sp. oral taxon 175 strain F0384 68.73 3133330
Rhodococcus equi strain ATCC 33707 68.72 5259057
Acidovorax avenae subsp. citrulli strain AAC00-1 68.53 5352772
Bordetella bronchiseptica strain RB50 68.08 5339179
Alicycliphilus denitrificans strain K601 67.81 5070751
Stenotrophomonas maltophilia strain JV3 66.89 4544477
Rhodobacter capsulatus strain SB 1003 66.56 3871920
Pseudomonas aeruginosa strain PA7 66.45 6588339
Ralstonia eutropha strain H16 66.29 7416678
Xanthomonas campestris pv. raphani strain 756C 65.29 4941214
Thioalkalivibrio sp. strain HL-EbGR7 65.06 3470516
Rhodopseudomonas palustris strain BisB18 64.96 5513844
Brevundimonas diminuta strain ATCC 11568 64.51 3369316
Rhodothermus marinus strain DSM 4252 64.09 3386737
Bradyrhizobium japonicum strain USDA 110 64.06 9105828
Mycobacterium tuberculosis strain C 63.82 4379118
Thermanaerovibrio acidaminovorans strain DSM 6589 63.79 1848474
Halomonas elongata DSM 2581 strain type DSM 2581 63.61 4061296
Novosphingobium nitrogenifigens strain DSM 19370 63.43 4182647
Polaromonas sp. strain JS666 62.24 5898676
Desulfovibrio africanus strain Walvis Bay 61.42 4200534
Candidatus Desulforudis audaxviator strain MP104C 60.85 2349476
Burkholderia rhizoxinica strain HKI 454 60.68 3750138
Slackia heliotrinireducens strain DSM 20476 60.21 3165038
Candidatus Nitrospira defluvii 59.03 4317083
Halogeometricum borinquense DSM 11551 58.43 3944467
Candidatus Hodgkinia cicadicola strain Dsem 58.39 143795
Sideroxydans lithotrophicus strain ES-1 57.54 3003656
Cenarchaeum symbiosum A 57.37 2045086
Serratia sp. strain AS12 55.96 5443009
Acidaminococcus fermentans strain DSM 20731 55.84 2329769
Hyperthermus butylicus strain DSM 5456 53.74 1667163
Methanosaeta thermophila (Methanothrix thermophila PT) strain PT 53.55 1879471
Neisseria gonorrhoeae strain NCCP11945 53.37 2236178
Treponema paraluiscuniculi strain Cuniculi A 52.74 1133390
Pseudovibrio sp. strain FO-BEG1 52.38 5916782
Nitrosococcus halophilus strain Nc4 51.60 4145260
Herpetosiphon aurantiacus DSM 785 50.84 6785430
Escherichia coli B strain REL606 50.77 4629812
Bdellovibrio bacteriovorus strain ATCC15356;
50.65 3782950
Pectobacterium wasabiae strain WPP163 50.48 5063892
Anaplasma centrale (Anaplasma marginale subsp. centrale str. Israel) strain Israel 49.98 1206806
Actinomyces coleocanis strain DSM 15436 49.47 1723843
Desulfotalea psychrophila strain LSv54 46.72 3659634
Polynucleobacter necessarius strain STIR1 45.56 1560469
Nitrosomonas sp. strain Is79A3 45.44 3783444
Coprothermobacter proteolyticus strain DSM 5265 44.77 1424912
Vibrio sp. Ex25 strain EX25 44.57 5160431
Geobacillus thermoglucosidans strain TNO-09.020 43.82 3740238
Waddlia chondrophila strain 2032/99 43.59 2139757
Bacteroides fragilis strain 638R 43.42 5373121
Thiomicrospira crunogena strain XCL-2 43.13 2427734
Coxiella burnetii strain CbuG_Q212 42.63 2008870
Chlamydia muridarum Nigg strain MoPn 40.27 1080451
Psychromonas ingrahamii strain 37 40.09 4559598
Nitratiruptor sp. strain SB155-2 39.69 1877931
Lactobacillus reuteri strain DSM 20016 38.87 1999618
Thermotoga lettingae strain TM 38.70 2135342
Streptococcus pyogenes strain Alab49 38.63 1841271
Bartonella bacilliformis strain ATCC 35685; KC583 38.24 1445021
Halothermothrix orenii strain DSM 9562; H 168 37.78 2463968
Staphylothermus marinus strain F1 35.73 1570485
Calditerrivibrio nitroreducens strain DSM 19672 35.69 2216552
Bacillus thuringiensis serovar andalousiensis strain BGSC 4AW1 34.96 5488844
Desulfurobacterium thermolithotrophum 34.95 1541968
Wolbachia pipientis strain wPip 34.19 1482455
Nitrosopumilus maritimus strain SCM1 34.17 1645259
Staphylococcus aureus strain 04-02981 32.90 2821452
Methanobrevibacter ruminantium strain M1 32.64 2937203
Rickettsia japonica strain YH 32.35 1283087
Methanocaldococcus fervens strain AG86 (v1) 32.21 1507251
Mycoplasma genitalium G37 strain G-37 31.69 580076
Nanoarchaeum equitans strain Kin4-M 31.56 490885
Orientia tsutsugamushi strain Boryong 30.53 2127051
Methanococcus aeolicus strain Nankai-3 30.04 1569500
Candidatus Pelagibacter ubique strain HTCC1062 29.68 1308759
Ehrlichia canis strain Jake 28.96 1315030
Arcobacter nitrofigilis strain DSM 7299 28.36 3192235
Clostridium botulinum A strain ATCC 19397 28.21 3863450
Parvimonas sp. oral taxon 393 strain F0440 28.17 1483165
Candidatus Arthromitus sp. strain SFB-mouse-NYU 27.94 1569870
Candidatus Blochmannia floridanus 27.38 705557
Buchnera aphidicola (Acyrthosiphon pisum) strain 5A 25.69 653223
Wigglesworthia glossinidia endosymbiont of Glossina brevipalpis 22.48 703004
Candidatus Sulcia muelleri strain CARI (v1) 21.13 276511
Candidatus Carsonella ruddii strain PV (v1) 16.56 159662

reade more... Résuméabuiyad